Do you freak out or feel stressed at the mere thought of trying to organize your ideas for a paper? Have you tried prewriting and outlining, yet can’t seem to pull your ideas together?
If all those Roman numerals and upper and lowercase letters of a traditional outline are enough to drive you mad, why not try a different way to organize your thoughts: use graphic organizers for writing.

What Is a Graphic Organizer?
A graphic organizer is a way to visually organize your ideas. It can help put your thoughts into place and help you see information at a glance.
Organizers can also help you see how ideas are connected, where they might fit into your paper, and where they may need further development. And most importantly, using graphic organizers for writing can help you keep your essay on track.
3 Types of Graphic Organizers for Writing Better Essays
Let’s take a closer look at three graphic organizers—flowcharts, Venn diagrams, and essay organization charts—and how you might use these graphic organizers for writing your paper.
Flowcharts

A flowchart is a diagram that illustrates a step-by-step process or sequence.
It’s pretty obvious that you could use a flowchart for a process analysis essay to show each step of a process. But a flowchart might be particularly useful for this type of essay if you can approach the task in several different ways.
For instance, let’s say you’re explaining how to build the perfect sandwich but are also adding recommendations for specific combinations along the way. Your flowchart might offer different meat or condiment choices depending on which bread you choose.
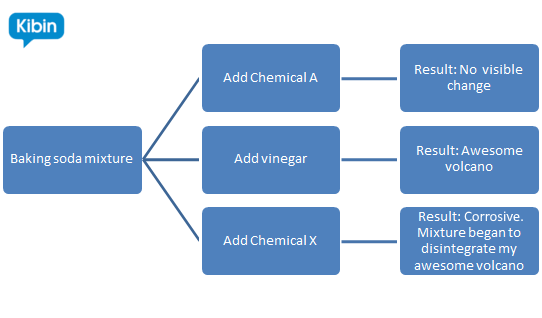
Flowcharts can also be invaluable if you’re writing a lab report. Let’s say you’re in your basement mixing chemicals, such as baking soda and vinegar, to create a volcano.
Your mad scientist self kicks in, and you decide to throw in a few other chemicals here and there, just to see how they react. (Unless you really know what you’re doing, though, I really don’t recommend haphazardly mixing chemicals. It won’t end well.)
If you have the proper safety equipment and a pretty good sense of how to mix chemicals, a flowchart can be an excellent tool to help you keep track of reactions.
Here’s an example of what your volcano flowchart might look like.
Ways to use a flowchart
Don’t limit your use of flowcharts to things like process analysis papers and lab reports. Flowcharts can be useful when writing about literature too.
Ever read one of those complex novels where there are about 50 characters that you need to keep track of? Use a flowchart to help you visualize how the characters are connected.
If you’re keeping track of a large family or of people who marry, divorce, and have kids with multiple partners, you might create a family tree to help understand how people are related.
If you’re reading a mystery novel, you might use a flowchart to organize patterns, movements, or interactions involving various characters. This can help you trace connections between characters and help you see whodunit.
If you’re reading a more gruesome and violent novel in which a gang or the mob is on a murderous rampage, you can even use a flowchart to help keep track of which gang member murdered which person.
Using this type of flowchart can be incredibly helpful. You’ll be able to not only see how characters are connected but also see the bigger picture—how plotlines and characters are all interconnected (which can help you write a stronger literary analysis).
How to create a flowchart: You can, of course, get out your pencil and paper and draw a few boxes and lines to create your own flowchart. But if you’d like to create one using a little technology, try Gliffy, one of the templates in Word or Excel, or the drawing feature in Google Docs to create your own. You can also download a free template.
Venn diagrams
A Venn diagram is a set of overlapping circles that illustrates the relationship between the set. They’re excellent graphic organizers for compare and contrast essays because you can write all the points that are different in the individual sections of the circles and all points that are the same in the overlapping sections.
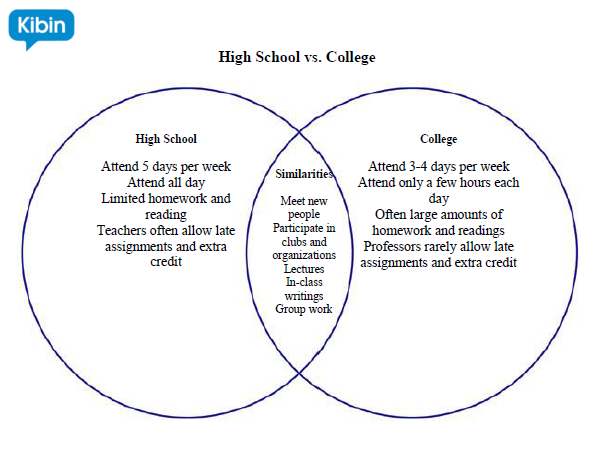
Here’s an example of what a Venn diagram might look like if you’re comparing high school to college.
Keep in mind that you don’t have to limit your use of Venn diagrams to compare and contrast essays about topics like high school vs. college. You can also use Venn diagrams to help create an awesome character analysis.
Let’s say you’re writing about The Wizard of Oz and want to analyze the Wizard. You might use a Venn diagram to examine his behavior in front of and behind the curtain.
Consider how he’s so brave and seemingly powerful behind the curtain and so quiet, with no powers, when in front of the curtain. His behavior, though, is similar in both situations as his underlying kind heart does shine through.
How to create a Venn diagram: As long as you have a pen and paper, it’s easy to draw two or three overlapping circles to create your own diagram. If you’d prefer to go high-tech, use the Smart Art features in Word or Excel, use a drawing program to draw circles, or use a free online template.
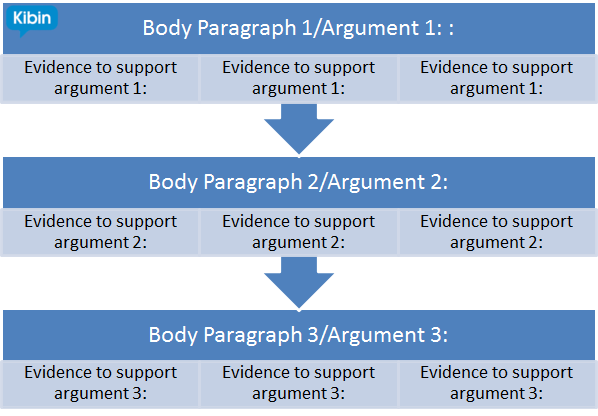
Essay organization charts
An essay organization chart is just that—a chart that helps you organize your ideas for an essay. You can use an essay organization chart with just about any essay, from a basic narrative essay to a longer, more complex research essay or argumentative essay.
The key to creating an effective organizational chart is to first decide on all the key components you’ll need for your paper. Then create a chart with space for each section.
This allows you to jot down and organize ideas without creating a formal outline or draft.
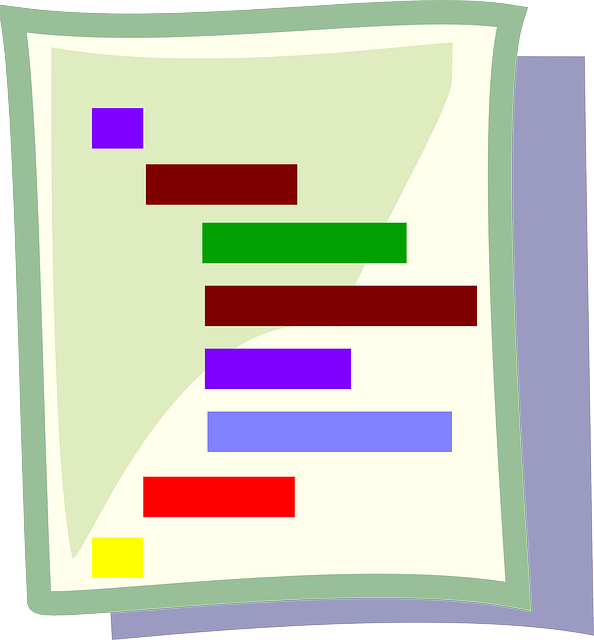
Below is an example of what a blank essay organization chart might look like. You can use this type of template for various essay types. You could even add more categories, such as a space for introduction ideas, thesis statement, conclusion ideas, and sources.
How to create an essay organization chart: One of the quickest ways to create an essay organization chart is to insert a table in Word (or a similar program) and fill in each square with the appropriate headings and content. You can also create something similar in Excel. If you’d like a pre-designed organizer, try one of these templates.
Bonus Tip!

Like a reverse outline, a graphic organizer can be useful after you’ve written your paper.
Depending on the type of paper, look over your draft and fill in your choice of graphic organizer to see what your paper looks like in organizer form. This strategy helps you see where you might have too much information or might be missing important arguments.
For instance, you can use an essay organization chart to make sure you have sufficient evidence to support each argument of your research paper.
You can use a Venn diagram to see how many points you’ve included for each section of a compare and contrast essay.
If your assignment is to balance similarities and differences, a Venn diagram can help you quickly see whether you’ve met assignment requirements.
Have you already completed a graphic organizer (either before or after) writing your draft but aren’t happy with the way it turned out? Let a Kibin editor help!